
Understanding Portfolio Drawdowns & Recovery Time
When an amateur investor evaluates a mutual fund or a stock, they typically look at only one number: the Compound Annual Growth Rate (CAGR). They obsess over how high the peaks are. However, when professional institutional wealth managers evaluate a portfolio, they obsess over an entirely different metric: The Drawdowns. They want to know exactly how deep the valleys are, and mathematically, how long it takes to crawl out of them.
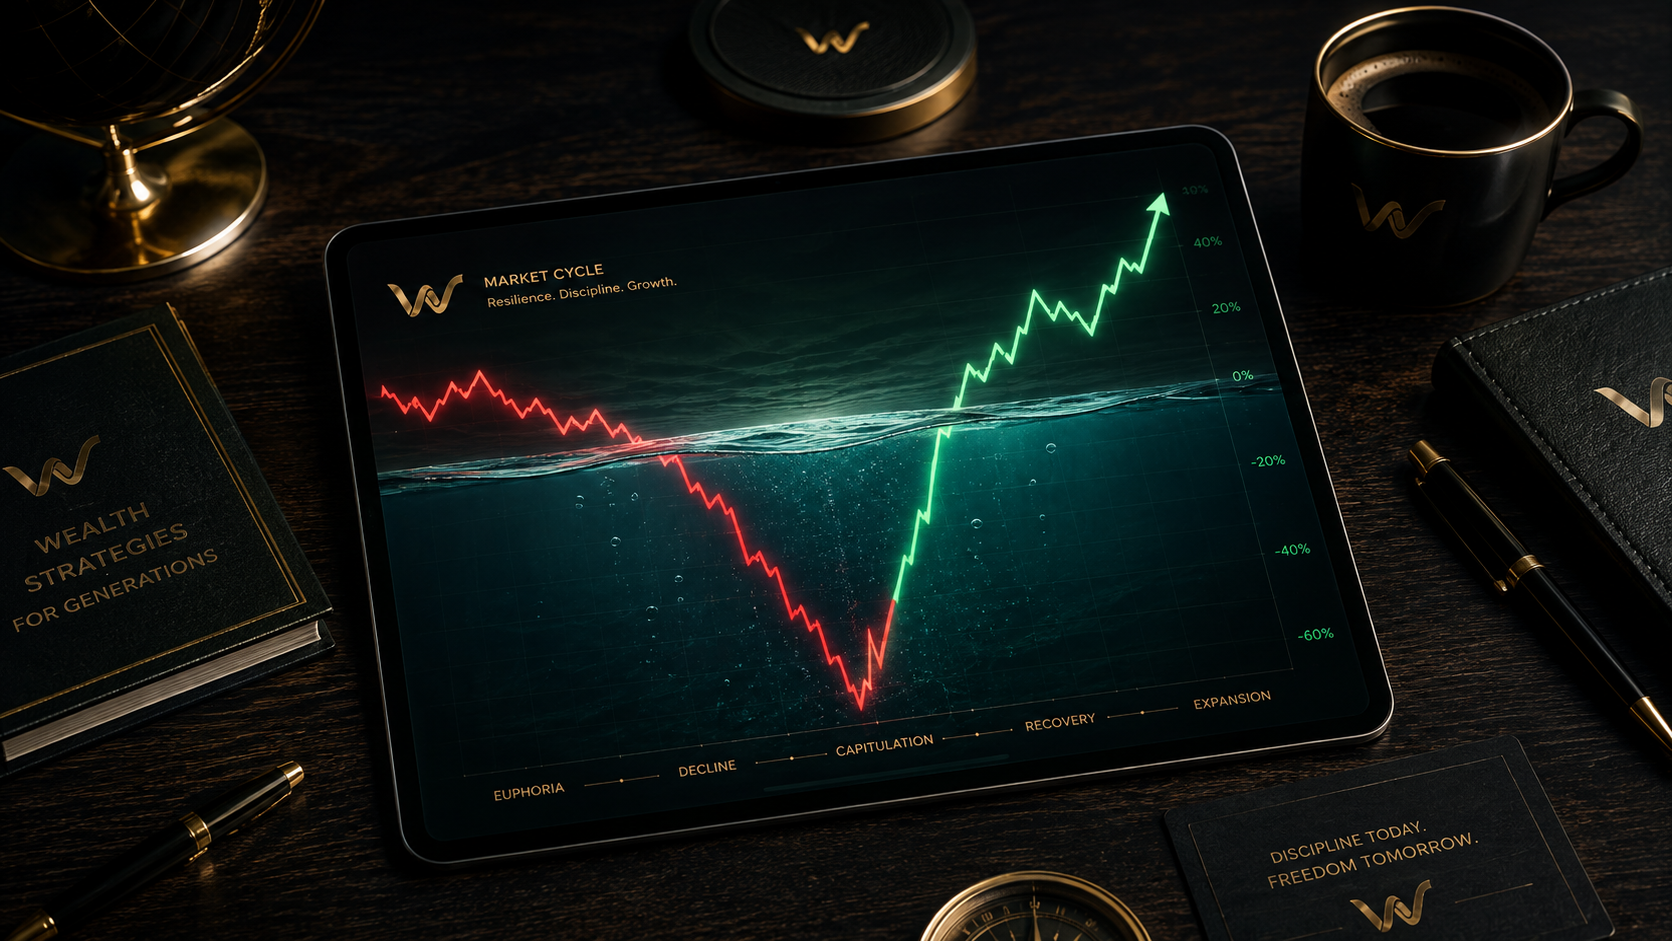
The harsh, undeniable reality of the global financial markets is that crashes are not anomalies—they are guaranteed, recurring features of the system. Whether it is the 2008 Global Financial Crisis or the sudden, violent pandemic crash of 2020, your retirement corpus will inevitably face severe trauma. Surviving these events requires understanding the brutal mathematics of loss.
Today, V-Mint Capital executes a deep dive into the mechanics of Portfolio Drawdowns and Recovery Time (TTR), explaining why successfully avoiding massive losses is mathematically far more critical than blindly chasing peak returns.
“Volatility is simply how much an asset bounces around. A drawdown is how much blood it actually bleeds. You can survive high volatility; you cannot mathematically survive a catastrophic drawdown.”
Priyam Verma, V-Mint CapitalWhat Exactly is a Portfolio Drawdown?
A portfolio drawdown is the mathematical measure of a decline from a historical peak in a portfolio’s value to its absolute lowest point (the trough), before a new peak is achieved. If you invest ₹10 Lakhs, it grows to ₹15 Lakhs (the peak), and then the market crashes, dropping your value to ₹12 Lakhs (the trough), you have experienced a drawdown of ₹3 Lakhs, or a 20% Drawdown.
Within the industry, the most critical metric we track is the Maximum Drawdown (MDD). MDD measures the absolute largest single drop in a fund or portfolio’s history. It is the ultimate “stress test” indicator. If a highly aggressive mid-cap mutual fund boasts a brilliant 25% CAGR but carries an MDD of 55%, it means that at some point in its history, an investor who bought at the top literally saw more than half their money evaporate.
The Cruel, Asymmetrical Mathematics of Recovery
Why are professional wealth managers terrified of large drawdowns? Because the mathematics of financial loss are completely and unforgivingly asymmetrical. A 50% loss is not recovered by a 50% gain.
If your ₹1 Crore portfolio drops by 50%, you are left with ₹50 Lakhs. To get back to your original ₹1 Crore, that remaining ₹50 Lakhs must now double. It requires a massive 100% gain just to break perfectly even. Look at the devastating curve below:
| Portfolio Drawdown (The Loss) | Required Gain Just to Break Even | The Reality for Retail Investors |
|---|---|---|
| -10% Drop | +11.1% Gain | Easily recoverable within a few months of normal market activity. |
| -25% Drop | +33.3% Gain | Painful, but fully recoverable within a standard 1 to 2 year bull cycle. |
| -50% Drop | +100.0% Gain | Catastrophic. Requires a massive, multi-year bull run to recover. |
| -75% Drop | +300.0% Gain | Generational damage. Most investors panic-sell before this point. |
| -90% Drop | +900.0% Gain | Mathematical ruin. You are effectively starting over from zero. |
This table perfectly illustrates why Position Sizing and strict risk management are mandatory. You cannot afford to let your portfolio bleed past the 25% mark, because the energy required to recover becomes exponentially harder with every percentage point lost.
Understanding ‘Recovery Time’ (The Underwater Curve)
While the depth of the drawdown (MDD) is terrifying, the Recovery Time—often referred to as the Time to Recover (TTR) or the Underwater Period—is what actually breaks a retail investor’s psychological fortitude.
Recovery Time measures exactly how many months or years a portfolio remains “underwater” before finally clawing its way back to its previous all-time high.
Historical Case Studies: The Nifty 50
- The 2008 Global Financial Crisis: The Indian Nifty 50 crashed violently, suffering a brutal Maximum Drawdown of roughly 60%. Because the depth of the loss was so extreme, the Recovery Time was agonizing. It took the index nearly 6 long years to permanently break past its 2008 peak. Investors who went “all in” at the top suffered half a decade of zero net growth.
- The 2020 COVID-19 Pandemic: The Nifty 50 suffered an incredibly fast, terrifying drawdown of roughly 38% in less than a month. However, because central banks injected massive liquidity globally, the Recovery Time was miraculously short—taking only about 8 months to hit new all-time highs.
How to Mathematically Destroy Drawdowns
You cannot stop the Nifty 50 from crashing. However, you have complete control over how deeply your specific portfolio crashes. At V-Mint Capital, we utilize institutional structural defenses to protect our High-Net-Worth (HNI) clients from the dreaded underwater curve.
1. Non-Correlated Asset Allocation
The ultimate defense is building a structurally sound All-Weather Portfolio. If your portfolio is 100% equity, you will eat the full 50% drawdown during a recession. However, if you allocate 40% of your portfolio to high-grade Debt funds and Gold ETFs, your drawdown is massively cushioned. Because Gold frequently spikes when equities crash, it acts as a literal shock-absorber, reducing a brutal 50% equity market crash into a manageable 15% overall portfolio dip.
2. Systematic Investment Plans (SIPs)
SIPs turn drawdowns into powerful wealth-building events. If you are dripping a fixed amount of capital into the market every single month (e.g., ₹25,000), a massive drawdown means you are suddenly buying mutual fund units at a 40% discount. This drastically accelerates your Recovery Time when the market eventually bounces back.
3. Systematic Transfer Plans (STPs)
If you receive a massive lump sum (like selling real estate or a business), deploying it completely into the stock market on a single day exposes you to maximum Sequence of Returns Risk. Instead, professional wealth managers utilize an STP. The lump sum is securely parked in a low-risk Liquid Debt fund, and a fixed percentage is mathematically transferred into aggressive equity funds every month, perfectly averaging out your entry price and neutralizing immediate drawdown risks.
Is Your Portfolio Ready for the Next Crash?
A severe market crash is inevitable. Ensure your hard-earned capital is protected by institutional risk management. Contact V-Mint Capital today to structurally audit your portfolio’s Maximum Drawdown exposure.
Request Risk Audit